A lab presentation on drawing publication quality figures and graphs.


Figures
In dynamics and control we use many types of visualization tools to explain and interpret our models and data. Some of the popular ones are:
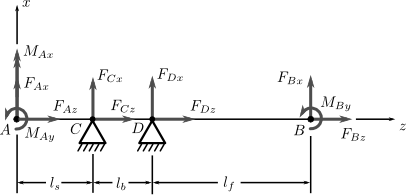
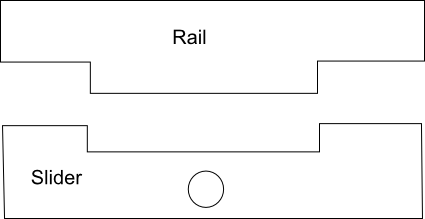
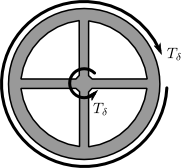
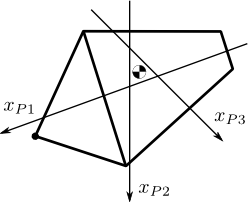
- Free body diagrams – Schematics for dynamic motion, forces, and configuration.
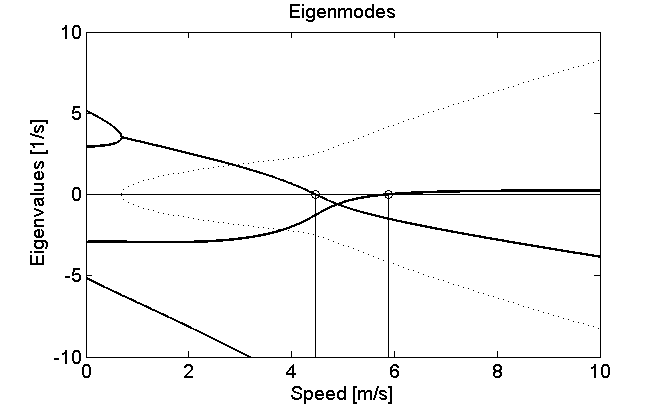
- 2D plots – basic ways to data such as a coordinate vs time or root loci
- 3D plots – 3D plots can show
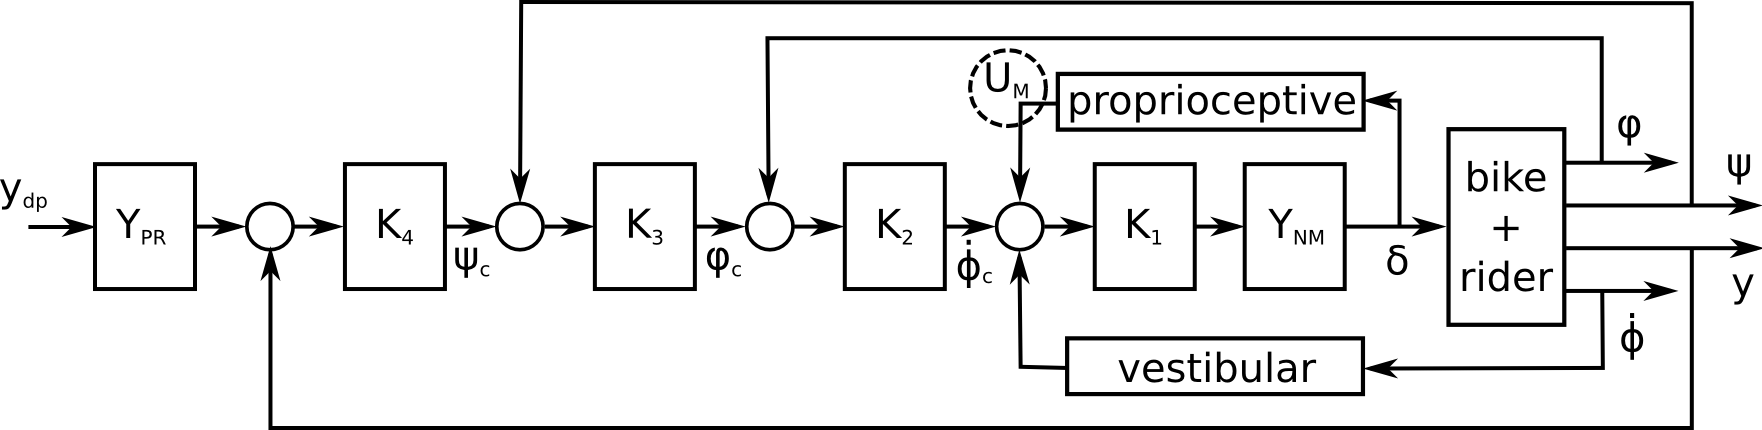
- Block diagrams
Art and Engineers
- Engineers typically want to have very accurate and precise drawings. But the best of visualization is not necessarily the most accurate or precise. Keep in mind that you want the figure to help someone else understand what you are describing. Often times a visualization that is moreartisticwill do a better job. Edward Tufte‘s work repeatedly demonstrates this.
Units
Units are pretty straightforward except for the notation of a pixel. Most units are physical distances in our reality, but a pixel isn’t. It can change from display to display. There are some compatibility issues that you should be aware of between printed media and video images for that reason.
- Standard units
- m+m, cm, inch, etc. These are straight forward and are used in many computer aided drafting/design programs.
Typography Units
- Points
- Traditionally used to measure fonts on printed pages and typography. Nowadays 72 points equals 1 inch (1 pt = 0.0139 in = 0.3528 mm).
- EM
- A relative measurement with respect to the point size of the type face. Used in typography and in html/css.
Computer Units
- Pixel
- The smallest single element of a digital image. The word resolution is often used for the amount of pixels in an image. The higher the resolution the better the ability to reproduce the actual image digitally. A pixel does not equal a standard physical dimension, it depends on the screen the image is being displayed on.
- Dots per inch
- A measure of spatial printing or video dot density, the number of individual dots that can be placed in a line within the span of 1 inch (2.54 cm). Correlates with image resolution, but is related only indirectly (from Wikipedia).
- Pixels per inch
- Can describe the resolution, in pixels, of an image to be printed within a specified space. For instance, a 100 x 100 pixel image that is printed in a 1-inch square could be said to have 100 dots per inch (DPI). Good quality photographs usually require 300 dpi. (from Wikipedia)
Documents
- Encapsulated Postscript (eps) – Postscript for independent images. Can be embedded in postscript files for easy layout.
- Portable Document Format (pdf) – Open standard for documents. Encapsulates a complete description of a fixed-layout 2D document that includes the text, fonts, images, and 2Dvector graphicswhich compose the documents (from Wikipedia).
- Device Indepent File Format (dvi) – Visual layout output file from Tex.
Word Processor Documents
- Open Document Format (odt) – XML based open standard for documents, spreadsheets, presentations, etc.
- Microsoft Word (doc, docx)
Web Documents
- Hypertex Markup Language and Cascading Style Sheets (html/css) – XML like markup language of the web. HTML and CSS allow the content to beseparatefrom the presentation.
Bitmap vs Vector
There are two primary types of image formats used to store image data.
- Bitmap – Images broken up into pixels (i.e. a small square that is a single color) [.gif, .jpeg, .png, .tiff]. Bitmapped images do not scale well.
- Vector – Images that are defined by a programming or markup language [.svg, .ps, etc]
- Postscript – A general purpose page description programming language.
- SVG is a language for describing two-dimensional graphics in XML. Standards:;http://www.w3.org/TR/SVG/
Comparison of bitmap and vector graphic

From Wikipedia.
Text and Equations
- TeX, LaTeX, LyX – Latex is hands down the best software for producing quality mathematical text.
- MathML – An xml based standard for describing mathematical equations. Will be standard on the web soon.
Plotting
The key to plotting is to fine tune your graphics output for the medium which it will appear. If you are printing a 2″ x 2″ plot for a journal paper, make damn sure that is what you plotting software is outputting. Then get you fonts and line widths dialed in. Make use of embedded Latex for getting your equations and variables looking good.
- GNU Plot – Classic open source plotting package.
- R – Open source stats program with various plotting packages.
- Matlab – Has many 2D and 3D plotting capabilities, including animation.
- Octave – Open source matlab clone that uses gnuplot for graphics.
- Matplotlib;- Probably the most popular python based plotting library. The syntax is very similar to matlab’s plotting commands. Check out the gallery of examples.
- SVGMath – A MathML to SVG converter.
- SVGKit – Can convert Latex to SVG, setup for dynamic web pages.
3D
- Blender – Open source 3D content creation suite (artistic)
- VTK – open-source, freely available software system for 3D computer graphics, image processing and visualization
- 3D Studio Max – 3D modeling, animation, rendering (artistic)
- Maya – 3D computer graphics.
- OpenGL – Open Graphics Library, and open api for 2D and 3D computer graphics.
- MayaVI– Python based 3D;visualization;and plotting.
CAD
- FreeCAD– Open source parametric solid modeling. Python based extensions.
- Google Sketchup – Google’s free 3D modeling program.
- Autodesk Inventor – A leading 3D cad software. Free use for folks with university email address.
- Solidworks – A leading 3D cad software.
Raster/Bitmap
- GIMP – GNU Image Manipulation Program. Open source tool for editing a wide range of bitmap formats.;One of the most successful and oldest open source software packages.;
- Photoshop – Professional quality raster graphics program. May be available in the campus media labs.
- MS Paint – Bare bones bitmap editor that comes with Windows.
- Python Imaging Library – Python based image manipulation code library. Allows you to manipulate images by writing code. These exist for other languages too.
- A list from Wikipedia.
Point and Click Vector Graphics
Use you mouse and keyboard commands to draw. A list of software.
- Inkscape – Open source vector graphics software for manipulating images in the scalable vector graphics (svg) format. It can export to png and pdf among others. It also can import pdf. Use the textext extension for nice editable Latex equations. Can even save as PSTricks for your Latex docs.
- Adobe Illustrator– Commercial vector graphics program for Mac/Windows.
- Basic diagram and vector graphics editors –Open Office Draw, Google Docs, MS Office
Program Your Vector Graphics
- Python
- Matlab
- PSHacker – Matlab wrapper to postscript.
- Blog post with a good tutorial for quality plots with Matlab: http://blogs.mathworks.com/loren/2007/12/11/making-pretty-graphs/
- Latex
Tips for good figures
- Make sure to size your figures to the same size as you want them printed.If you make a high resolution export that is a very large size, you can potentially resize it to make it fit in your paper. But remember that the resize will change all of the font sizes. In word processors like MS word and Open Office it is very tempting to drag resize your images so they fit. Do not do this! You will always distort the image.
- Make use of vector graphics based formats for clean resizing, multi-use, small file sizes.
- In Matlab and matplotlib resize your plots, set font sizes and line widths, use Latex commands for symbols, text and equations. I typically export as pdf or eps for easy inserting into pdf latex documents. Here is one example of some things to improve your plotting in Matlab.
- The golden ratio makes for good width to height ratios.
- If you have to use bitmap (jpg, png, bmp, gif) images use at least 300 dpi, especially for photographs.
- Color is great but many journals still print in greyscale as a default. Make sure you adapt adjust the greyscale yourself so that for photographs. Make use of different line types and line markers in plots. Sometimes greyscale lines are tough to see.
- Don’t forget axis labels, tick marks, units, etc. These details are very important!
- Make sure subplots are aligned properly with each other. This includes the tick marks.
- Make sure your graph fonts match the fonts in the paper text. Size the fonts accordingly, 8-10pt font is about as small as you should make text on a paper for readability. Remember that some people may not be able to see as well as you.
- Use embedded Latex for your equations and greek symbols. Matlab, matplotlib and many other programs have this ability. MS Word and other word processors generally do a horrible job at typesetting mathematics. Avoid them if at all possible.
- Experiment with more artistic ways of drawing your figures, don’t be stuck withing the boundaries of engineering graphics.
- Plots from spreadsheet programs like Excel are not publication quality. They typically look pretty bad.
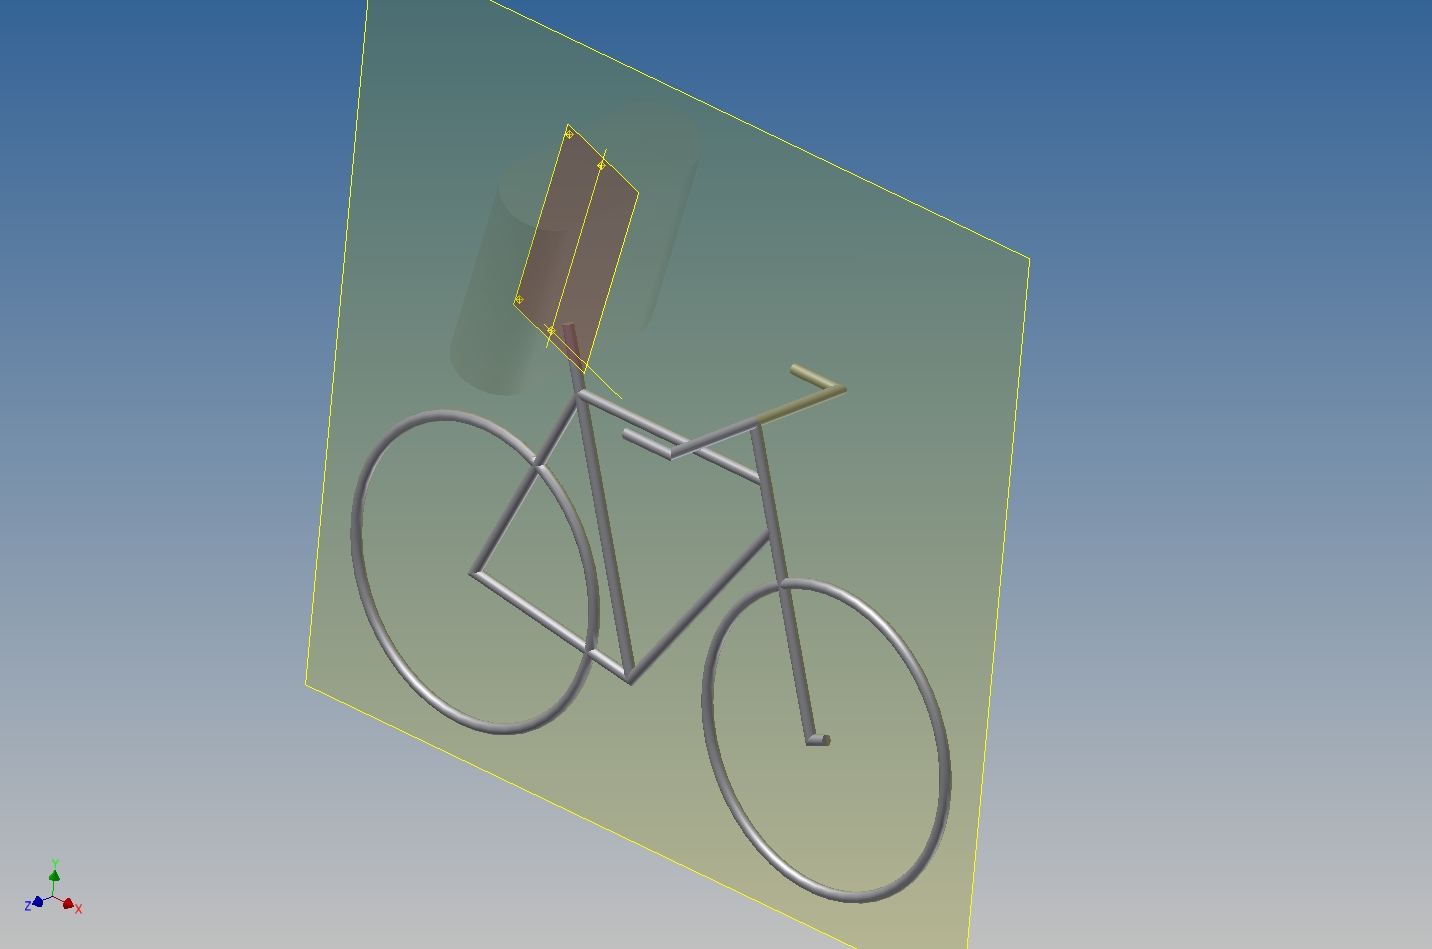
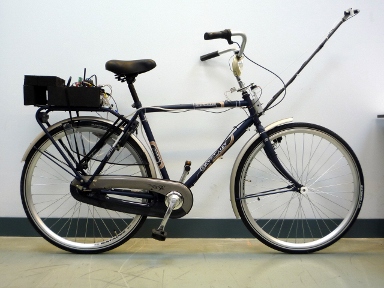
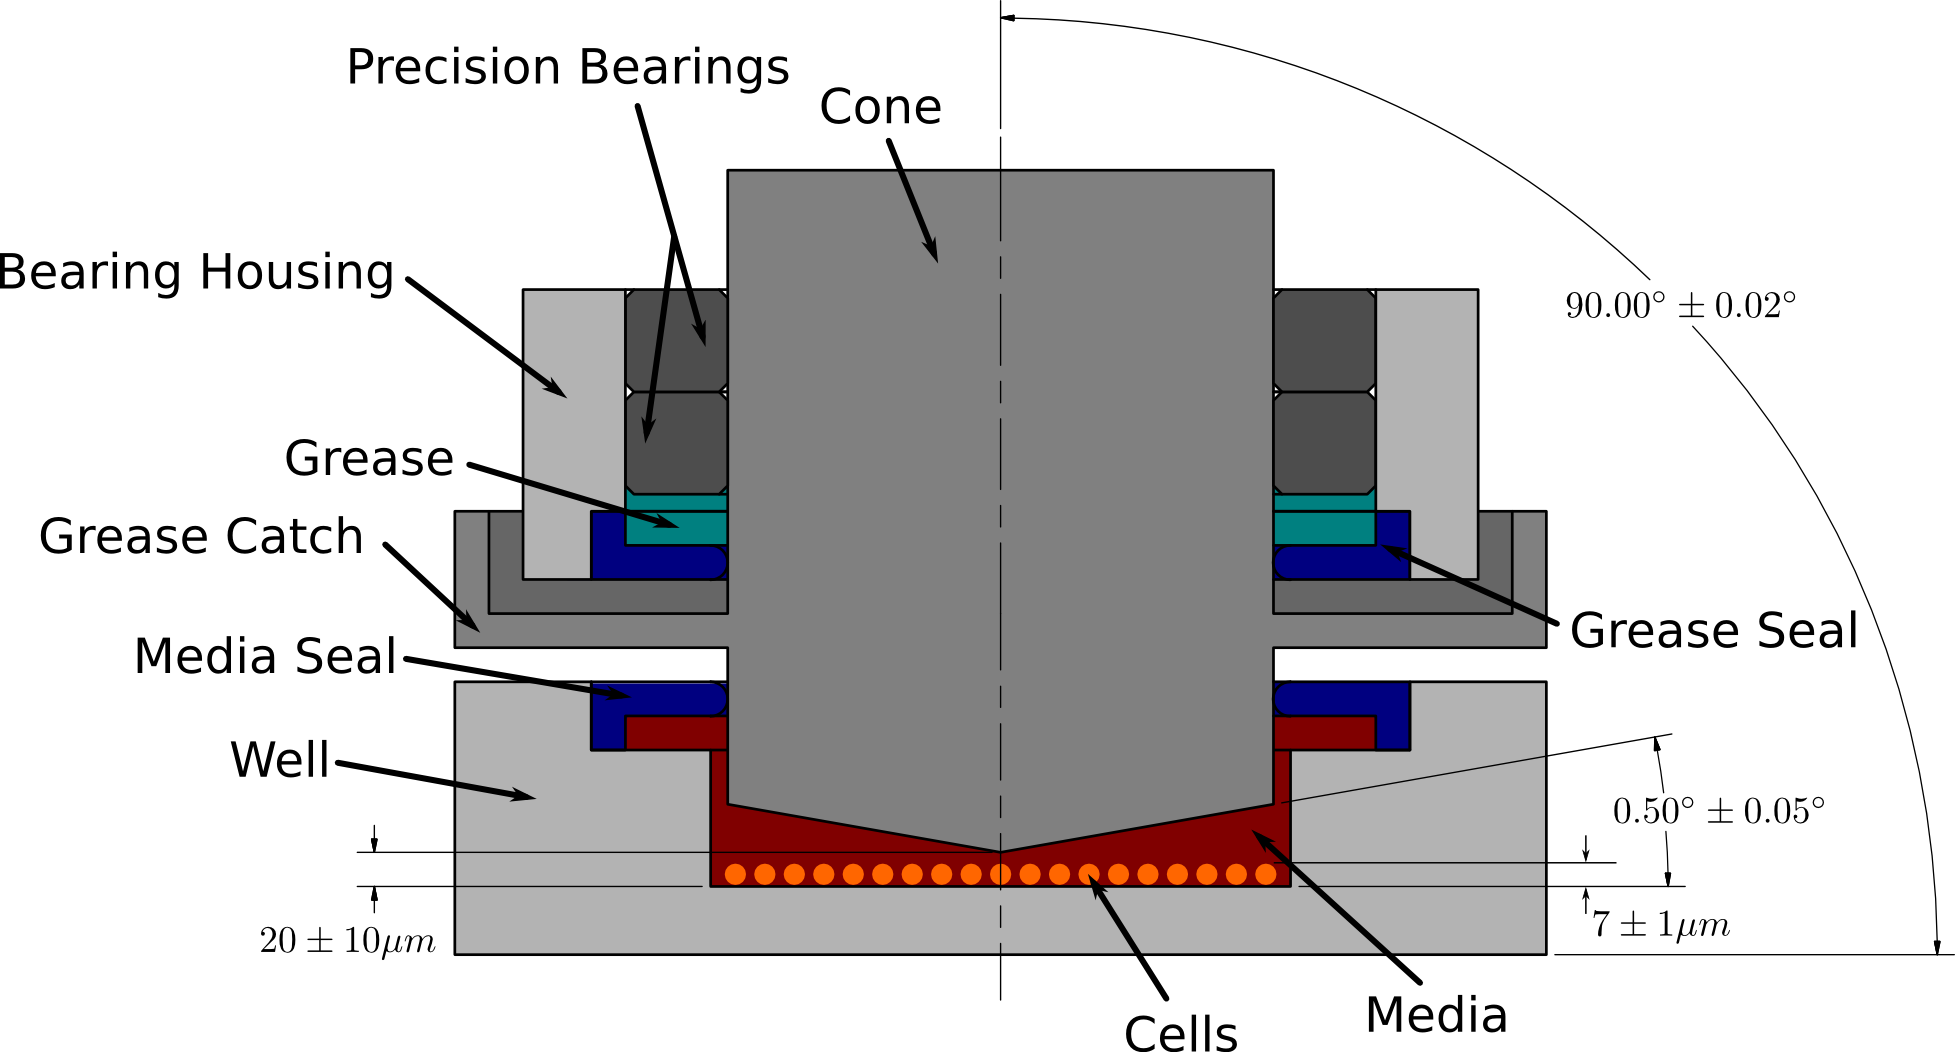
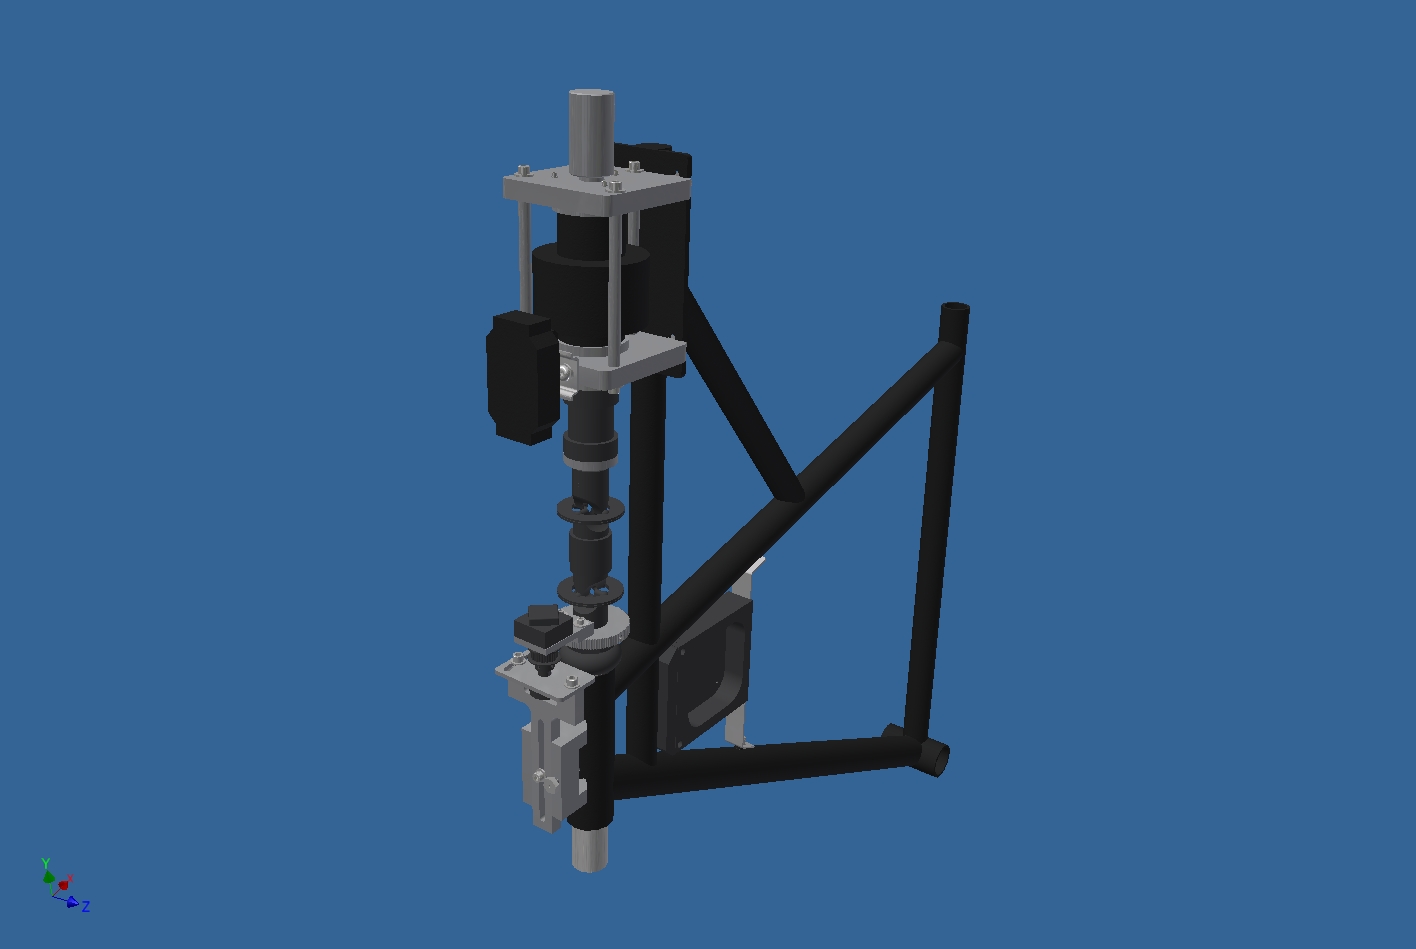
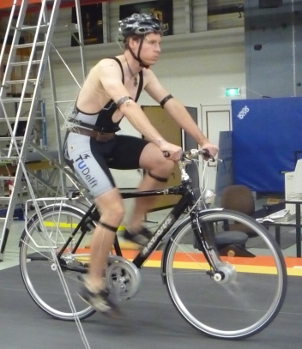
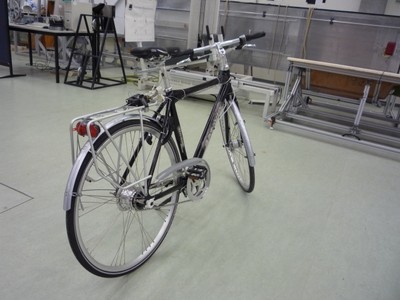
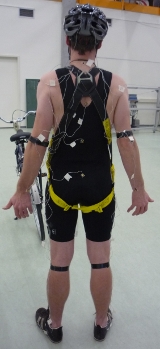
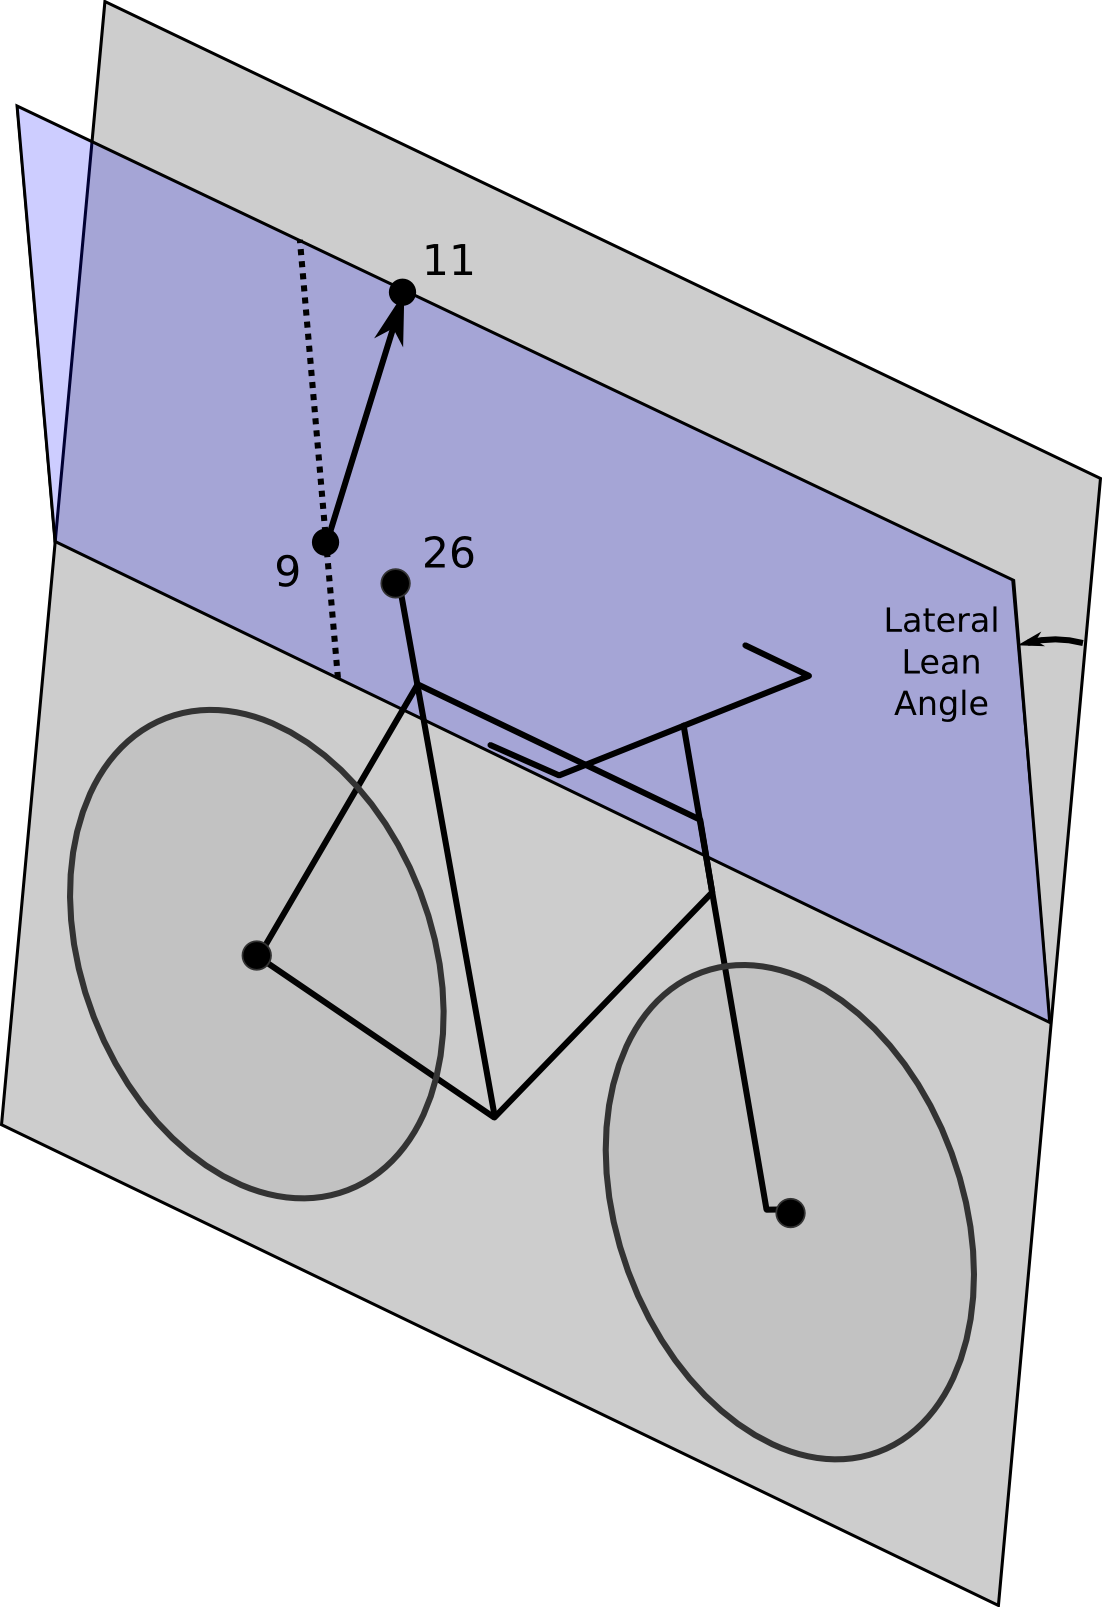
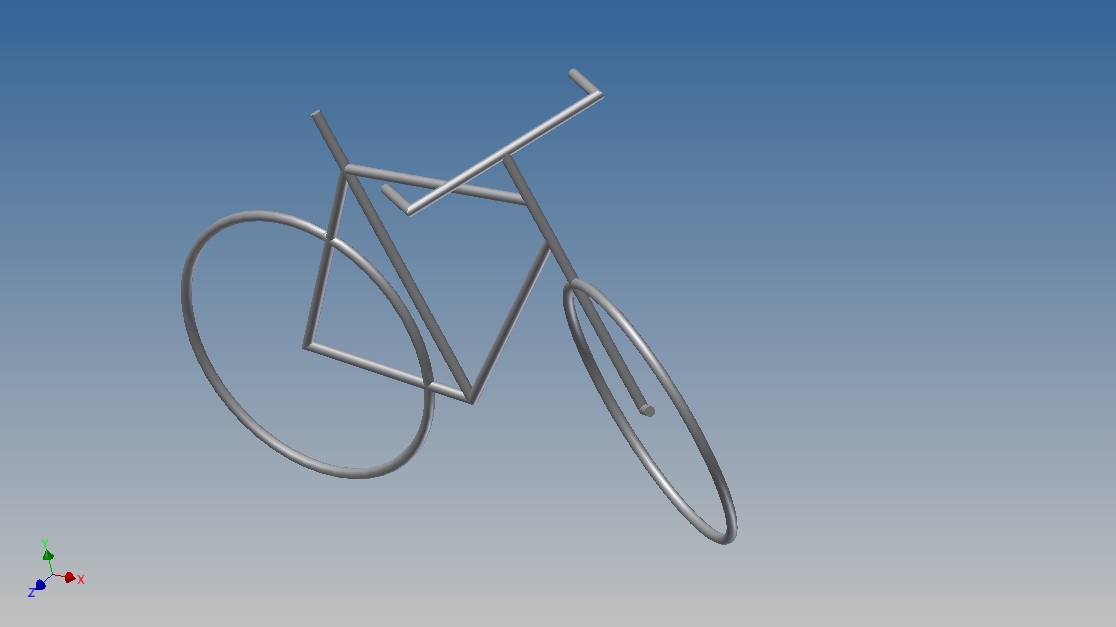
- Use scanned hand drawn images, photos or outputs from CAD as a background to trace vector graphics over, then delete the background. Helps give realistic three dimensional shapes.
Examples
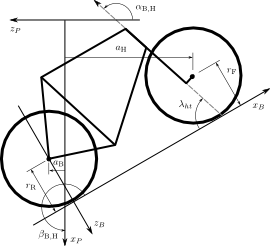
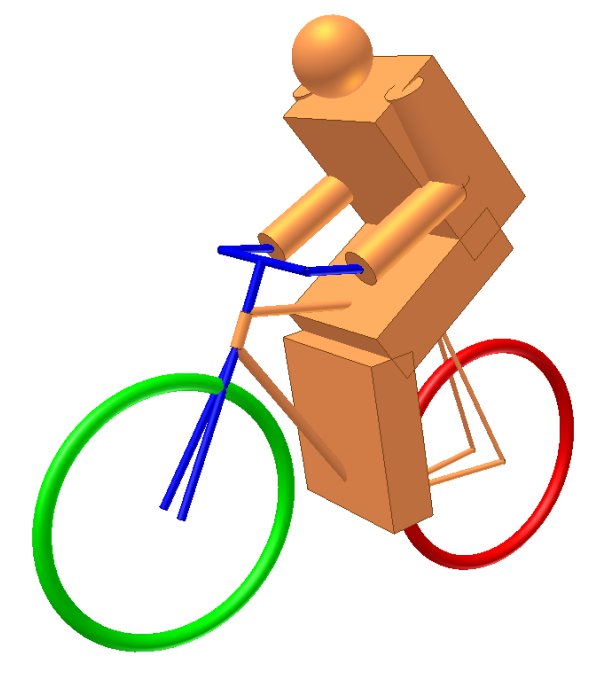
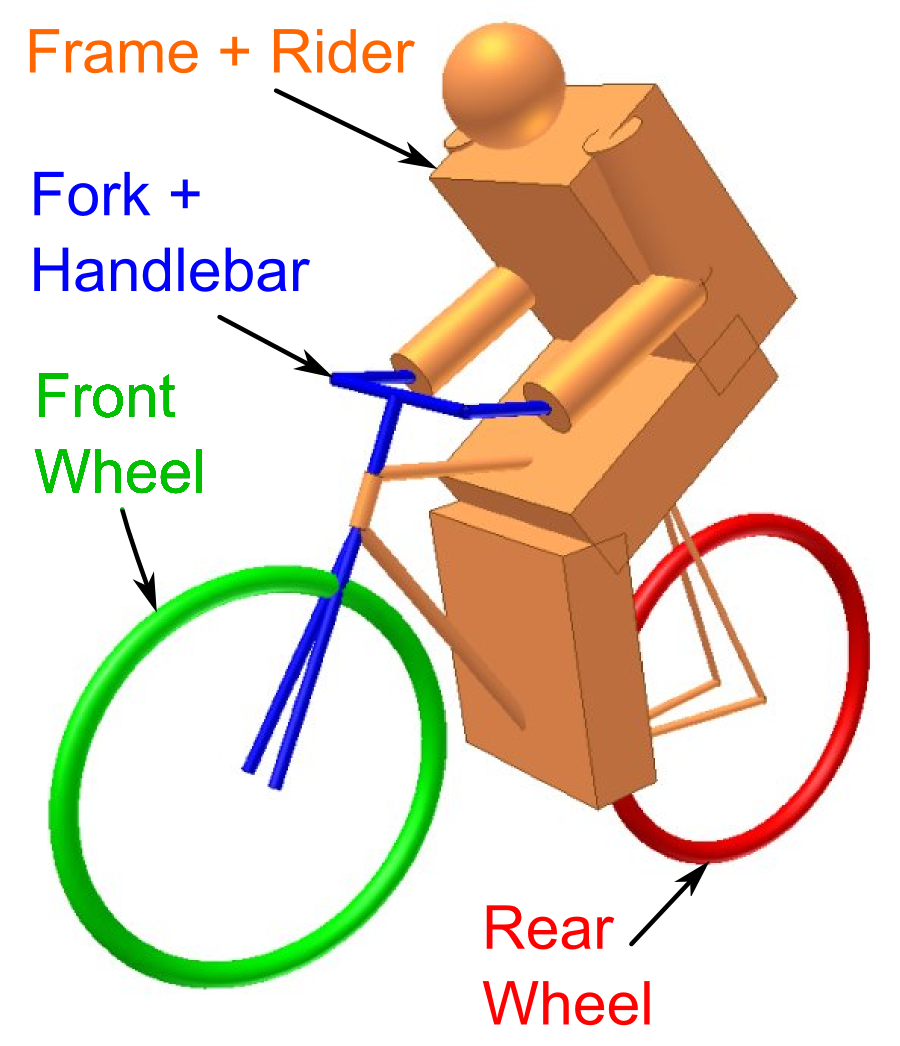
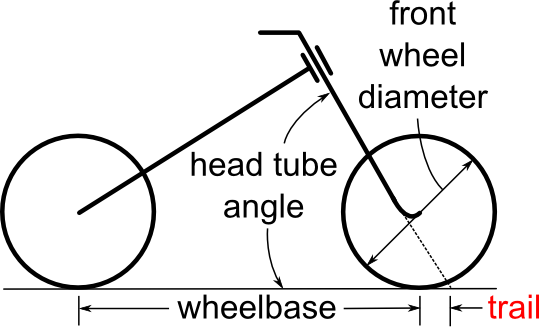
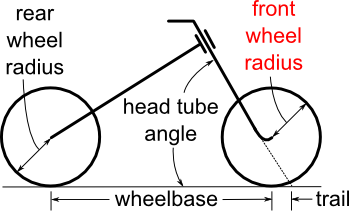
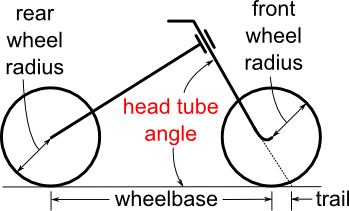
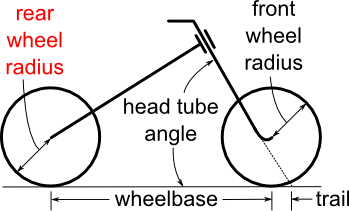
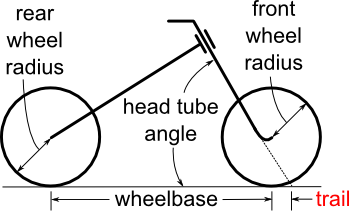
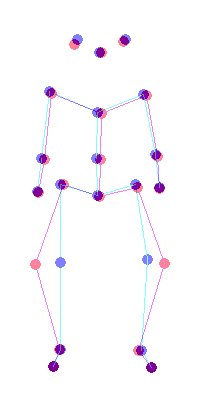
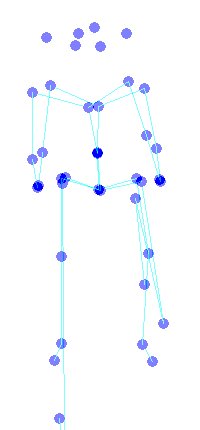
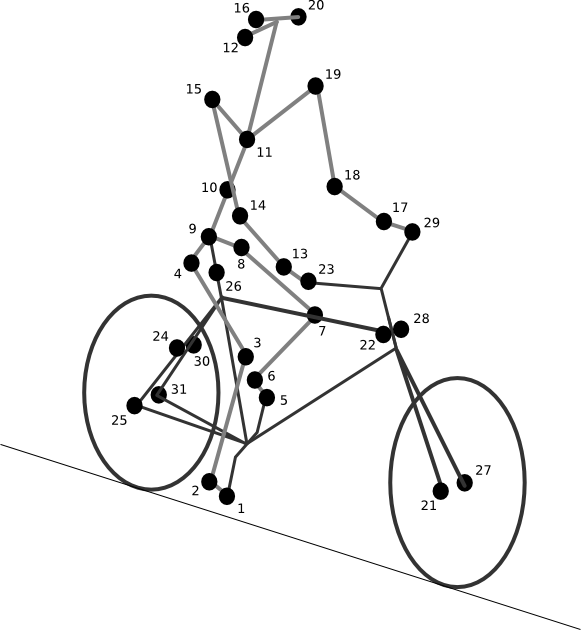
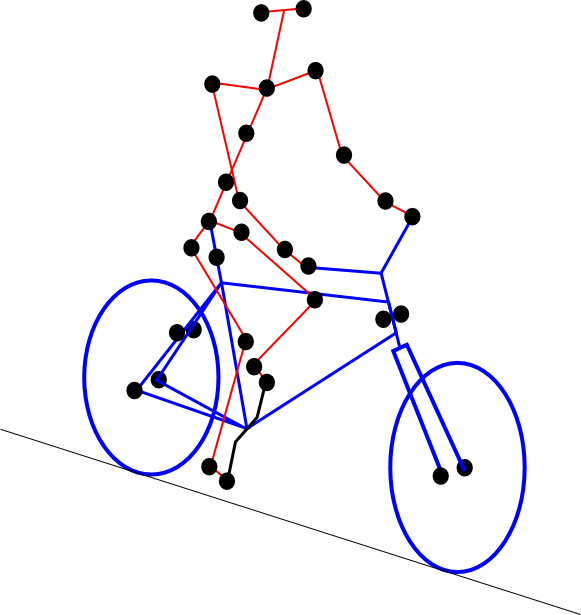
- PSHacker bicycle drawing and data plot
- Matplotlib plot for latex documents
- SVGFig test code
- Various Inkscape drawings
Links
- Usefull Matlab function for applying style sheets to your figure: http://www.mathworks.com/matlabcentral/fileexchange/24807-sdf-set-the-figure
- http://nibot-lab.livejournal.com/73290.html
- How to include an SVG image in LaTeX: http://ctan.math.utah.edu/ctan/tex-archive/info/svg-inkscape/InkscapePDFLaTeX.pdf