Liquid water distribution is stongly coupled with reactant flow distribution in an opeating PEM fuel cell. Three dimensional flow simulation was performed to account for the effect of reactant flow on the liquid water accumulation and distribution. The simulation results were compared to the experimental measurements to provide analysis on and elucidate the characteristic of liquid water accumulation, distribution and removal from the operating PEM fuel cell. Figure 1(a) represents a colorized neutron image when the current density is 0.75 A cm-2 and the cell temperature is 60 oC. The image is carefully overlapped with the anode flow channel to distinguish the location of liquid water. As shown in a magnified view on the left, the thick liquid water accumulation (horizontal strips) exactly matches the anode flow channel area. Figure 1(b) shows a 3-D flow simulation result for the anode stream in which the magnitude of the cross flow velocity in the GDL is presented as a contour plot. The permeability of GDL K, was chosen as 1.76 × 10^-11 m^2, to fit the amount of pressure drop for the present design. The same part with the cell area in Fig. 1(a) is magnified for the contour plot to compare the velocity distribution with the liquid water distribution. The simulation result indicates that the magnitude of velocity is relatively lower in the GDL adjacent to the flow channel area and this area corresponds to the thick liquid water accumulation in Fig. 1(a).
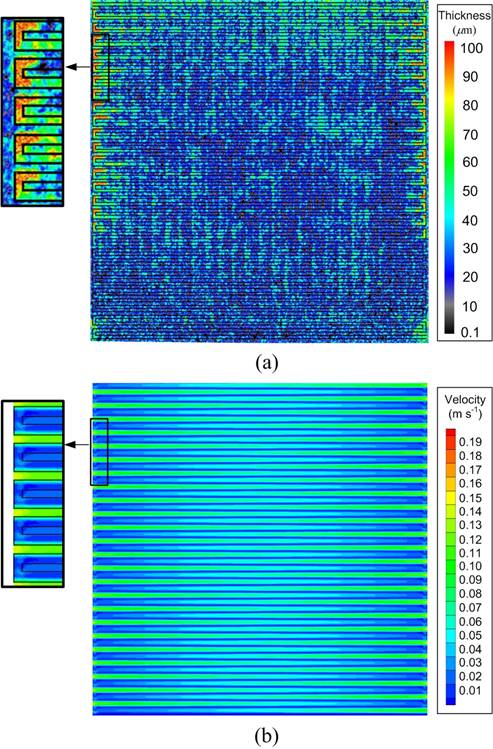
Fig. 1 Effect of the cross leakage flow on the liquid water distribution in a PEM fuel cell; (a) a colorized neutron image; liquid water distribution in an operating fuel cell (b) a contour plot of the reactant flow velocity in the gas diffusion layer
Figure 2(a) shows a 3-D vector plot at a U-turn of flow channel which is indicated as grey area. Red and green vectors represent velocities in GDL and flow channel, respectively. It is seen that the reactant velocity in the GDL is higher under the land area while it is substantially lower under the channel area. The pressure contour plot in Fig. 2(b) confirms that the pressure gradient across the GDL under the land area is much higher than that under the channel area resulting in higher velocity under the land area. As a result, the liquid water could be accumulated more easily in the GDL under the U-turn of the flow channel as shown in Fig. 1. The reactant velocity becomes slower in the downstream due to the depletion of reactant gas although present result does not show that trend by neglecting chemical reaction. It may be concluded that the thick liquid water accumulations (horizontal and vertical strips) observed coinciding with the anode and cathode channel areas exist in the GDL adjacent to the flow channel except for the water in the membrane.
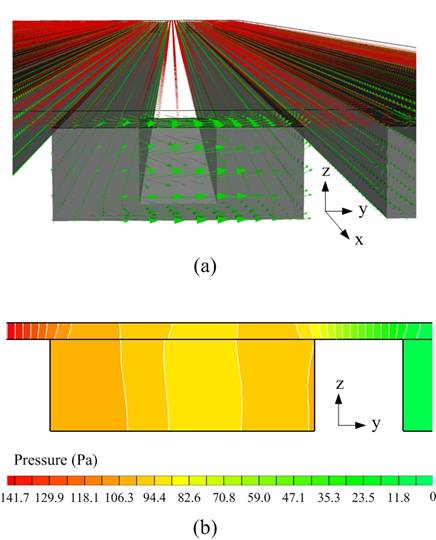
Fig. 2 Flow distribution at the U-turn of the flow channel (Red = 200, K = 1.76 × 10^-11 m^2); (a) 3-D vector plot (grey area indicate the inside of flow channel; red and green vectors represent velocities in gas diffusion layer and flow channel, respectively), (b) 2-D contour plot for the relative pressure on the plane x = 99.5 mm (0.5 mm away from channel wall)